
"All perception of truth is the detection of an analogy." -Thoreau
In my first post to this blog I discussed the meaning of the scientific concepts of hypothesis and theory. I highlighted how the public tend to think of “theory” in the same way that scientists think of hypothesis, in other words as an idea or educated guess. In fact theory is a word we use to describe the scientific models that we have the utmost confidence in. I’d like to elaborate a little on the concepts of hypothesis and theory and how they relate to what we call reality or fact.
All of science begins with observation. We sample the world and derive data from it. We can make data from all sorts of measurements, indeed from literally anything we can observe and measure. We might be measuring the height of people, the amount of heat produced by chemical reactions or counting the number of bacteria on people’s coffee mugs.
Analogy time
Let’s consider a simplified and slightly unrealistic analogy. First, we’ll pretend that we know very little about the subject of the study we’re about to do; people. Perhaps we’re aliens (or just really antisocial) but we don’t know much about people and we want to find out more. We’re most interested in the relationship between the size of people and how old they are. So we plan to measure the height of people and their age and plot this data on a graph called a scatter plot. Every person we measure appears as a blue dot. The higher up the graph they are, the taller we’ve measured them to be. The older they are, the further to the right they’ll be.
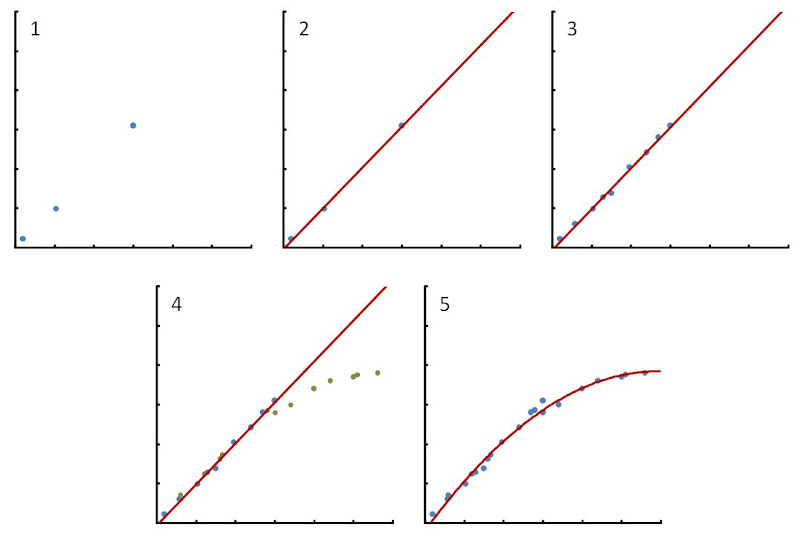
When we first begin to measure a thing, it can be difficult for us to determine if there are any patterns in the data, any meaning to be found. Look at graph 1. We antisocial scientists have made our first few measurements. Although it is far too soon to be confident that there’s a pattern here, it looks a bit like there’s a relationship between height and age in humans.
So we can create our first hypothesis. In graph number 2, we create a line which joins the data points together and also projects beyond them. We’re assuming that the relationship will hold for all people we measure, just for the moment. Just to make it sound important, we call our new hypothesis the Linear Growth Model or LGM (scientists love acronyms). The line is the hypothesis, a provisional model that we’ll cautiously use as a starting point. Put into words, the hypothesis would state: there is a linear relationship between the height of people and their ages. A statement of fact that we can now test.
The LGM is a good scientific hypothesis for that one important reason; it makes predictions that we can test. If the Linear Growth hypothesis is correct, then we expect that when we make more observations, they’ll appear on or near to our line. The scientific philosopher Karl Popper considered one other feature to be essential for a hypothesis to be valid; falsifiability, the possibility that our hypothesis can be shown to be incorrect by testing. At this early stage, our hypothesis could be falsified by finding just a few data points that fall far from out trend line. So of course we further test our model, measuring more heights and more ages. And when we look at graph 3, it seems we’re on to something! At this point it’s worth mentioning error. Measurements may often be subject to error. When measuring height, we might make a mistake. Or the height for people of the same age may vary (we know that it does of course, but for the purposes of our analogy let’s play dumb). So we often make the same measurement numerous times, or test many people of the same age. What we’ve done is measure our uncertainty and we can represent that uncertainty by drawing error bars that come out of each data point. We won’t worry about this further, but the point is that even though our data points may not exactly land on the red line, we are satisfied as long as the line passes through the area of error that lies around the data point.
With more and more data collected, our imaginary scientific colleagues now accept the Linear Growth Model as a satisfactory and useful model. It has become the Theory of Linear Growth. However, as often happens in science, it turns out that our theory is not entirely accurate. We realise that we’ve been building our model, the line, based on a very narrow data set. Because if you recall, we’re not all that familiar with how people work. And what we’ve gone and done is only measure the humans hanging around a playground. Some bright spark twigs that humans have loads of other habitats we didn’t observe. But maybe it’ll be okay, let’s find out. If the theory of Linear Growth is universally correct, then any new data points we get should continue to fit on our line. Of course we can see where this is going now, but let’s play dumb and continue.
When we extend our observations to older and older people, we start to see some data points that don’t fit our model at all. Had we seen these first few contradictory data points back at the start, it might have immediately caused us to discard our hypothesis before it even became theory. But with so much data in support of the theory, a few pieces of data are not sufficient for us to throw out the Linear Growth theory at the drop of a hat. As the saying goes, extraordinary claims require extraordinary evidence. But as we make more observations, the evidence becomes more compelling. In graph 4 it finally becomes clear to us that our theory has been falsified by the new data points shown in green. Too much of that data does not fit our model and thus we can no longer say that it represents fact.
Revolution!
So it turns out our old model doesn’t really work. But all is not lost. With our new data we can create firstly a new hypothesis and, in time, a new theory. In graph number 5 we see a curved red line that is the new Growth Plateau Model, a more comprehensive development of the now discarded Linear Growth Model. And so the old theory must be put aside- it serves as a model for the growth of children but is not useful outside of that context.
Our brand new Growth Plateau Model is testable and it has predictive power. We’re not concerned about gaps between the data points, because gaps do not falsify a model- contradictory data does. Were we to find many data points far from our line, we’d know our model was not accurate, assuming this was not explainable by some other means. But as the data keeps coming in, we find that the model holds for every observation.
Of course, hypothesis and theory aren’t strictly about scatter plots and trend lines. But this serves well as an analogy for how the process really works in science. Real hypotheses may be just as simple as that single statement about the linear relationship between aging and height. Theories however, are typically built from the combination of many hypotheses and unlike our analogy; they must not only have predictive power but also have explanatory power. We must be able to test the mechanisms that underlie the relationships we’ve modelled. But that concept of modelling reality, of joining the dots between our observations and testing that model, is fundamental to science. Just as fundamental is the moment we falsify our model and thus discard it. It is this moment, in which we build a new model upon the data, which sets science apart from dogma, in which no change is permissible, and diagnosis, in which we attempt to fit the data to various pre-determined models. Sometimes, as we saw with the Linear Growth Model, we don’t need to discard the old model, as in essence it becomes a small part of a bigger model and can still be useful in a limited way. In real science we can see many examples of this sort of “re-framing” of a theory rather than outright scientific revolution. For instance, although we’ve since come to understand modern genetics, the processes of variation and natural selection explained by Darwin are still a part of the modern theory of evolution. Similarly, the rise of Einstein highlighted the shortcomings of the Newtonian explanation of gravity, but we still use Newton’s laws for many simple applications. These theories, and indeed all good theories, share the predictive power of our made-up theory. Evolutionary theory allows us to predict what we’ll find in the fossil record and the genetic codes of organisms, and provides an explanation for those findings. To date, it has not failed us in either regard. Relativity explained peculiarities in the orbit of the planet Mercury and predicted strange effects of high speed upon the flow of time that would later be observed in experiments. So we can have great confidence that the untested predictions of these theories are accurate, that our models represent fact.


3 comments:
What are you trying to say... I'm not getting any taller??
Well, we could always go by Creationist logic. There is some margin of error as to when you will plateau and at what height. Thus, we can conclude that you'll grow exactly as much as you assume a priori.
Personally i think the only reason the word, "hypothesis", never enters my vocabulary in everyday social situations is the simple fact; thesis is shorter and easier to say plus,i don't feel bad about it because most people are ignorant of the difference or just don't care.
Anyone agree?
Post a Comment